Overview
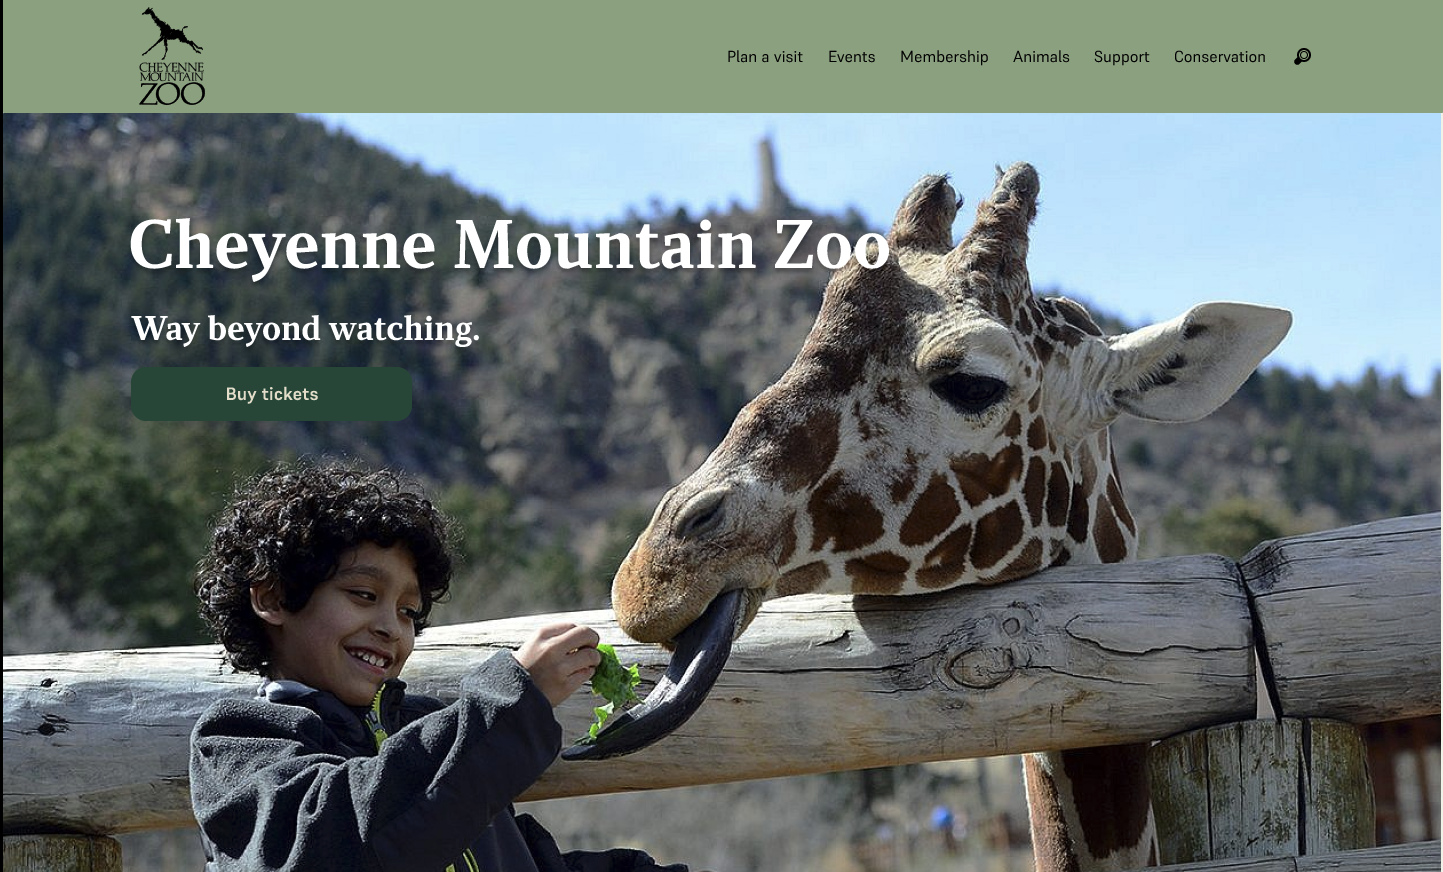
This project was about redesigning the ticket purchasing experience for Cheyenne Mountain Zoo's website. From my usability testing, I found out the existing flow was frustrating and confusing for users, something that could directly impact ticket sales. So the goal was to streamline the purchasing journey to reduce frustration and hopefully improve conversions.
The Challenge
Redesigning a ticket flow that was already complex and trying to simplify it while also still providing all of the information that a person would want or need.
The project scope was limited to the ticket purchasing flow, so I couldn't address broader site-wide issues. All research was qualitative too—usability testing rather than quantitative analytics like conversion rates or drop-off data.
This pushed me to develop new skills in translating user feedback into actual design decisions, rather than relying on the hard metrics I was more used to working with.
Research
Evaluating the Current Experience
From my own go-through in class, there were a couple things I noticed about the website:
- How much text and scrolling there is
- How confusing it was to get to certain parts
The wording on the buttons is clear, but when you're going through the website and seeing how dense everything is, it's kind of confusing on how to actually get there. Once you do get to that section, you're redirected to a whole new website that tries to mimic the original design. It's on a new domain though, and the design is very poor—it tries to mimic the original, but it doesn't do a very good job.
Usability Testing Findings
But actually going out into the field and doing testing validated these initial observations. I conducted usability testing with five participants on the existing website, focusing on the ticket purchasing flow. We found the following pain points:
| Pain Point | User Quote |
|---|---|
| Too many redirects | "I've been rerouted 4 times just to buy tickets" |
| Confusing date/time selection | Expected a calendar, got a confusing dropdown with an expanding green box |
| Poor visual design | Described as "ugly," "outdated," and inconsistent |
| Information overload | Too much text and redundant disclaimers |
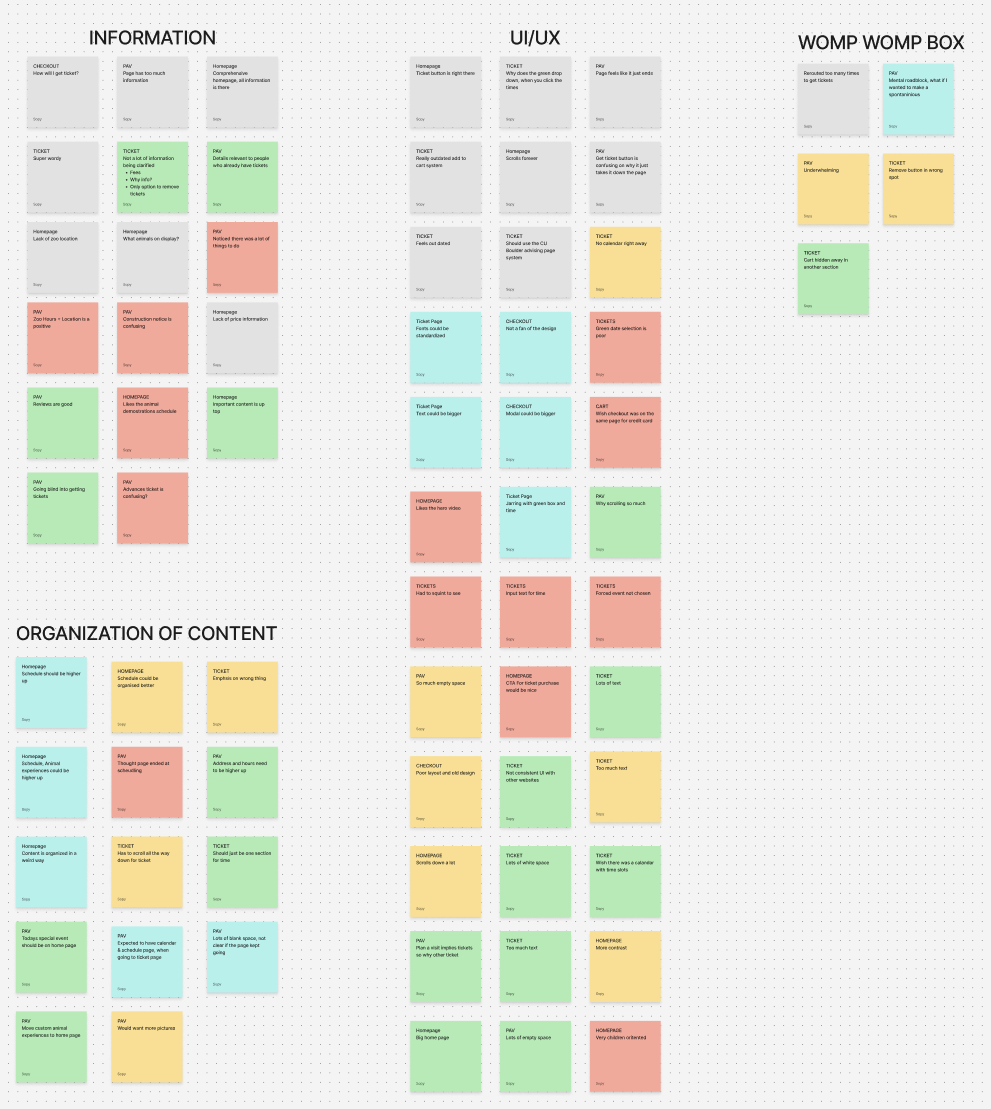
Based off the affinity map, I landed on a couple of How Might We's, but the one that I ended up focusing on the most was:
How might we simplify the ticketing process for users?
- Simplifying the path to purchase
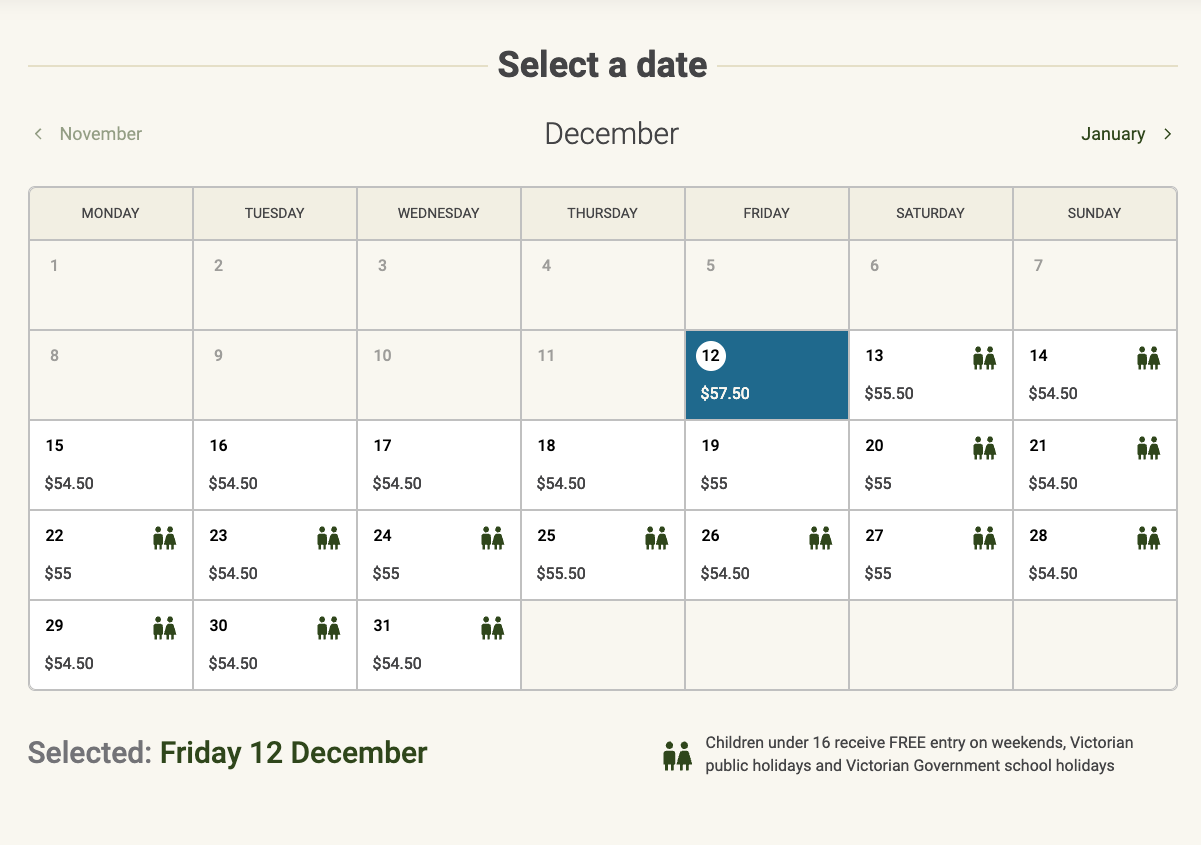
- Implementing a visual calendar for date selection
- Reducing information overload
- Creating a consistent UI that matched the quality of the homepage
Design
Problem Statement
Families need concise and easy-to-access information about tickets because they want to be able to know what they'll see at the Zoo if they buy tickets.
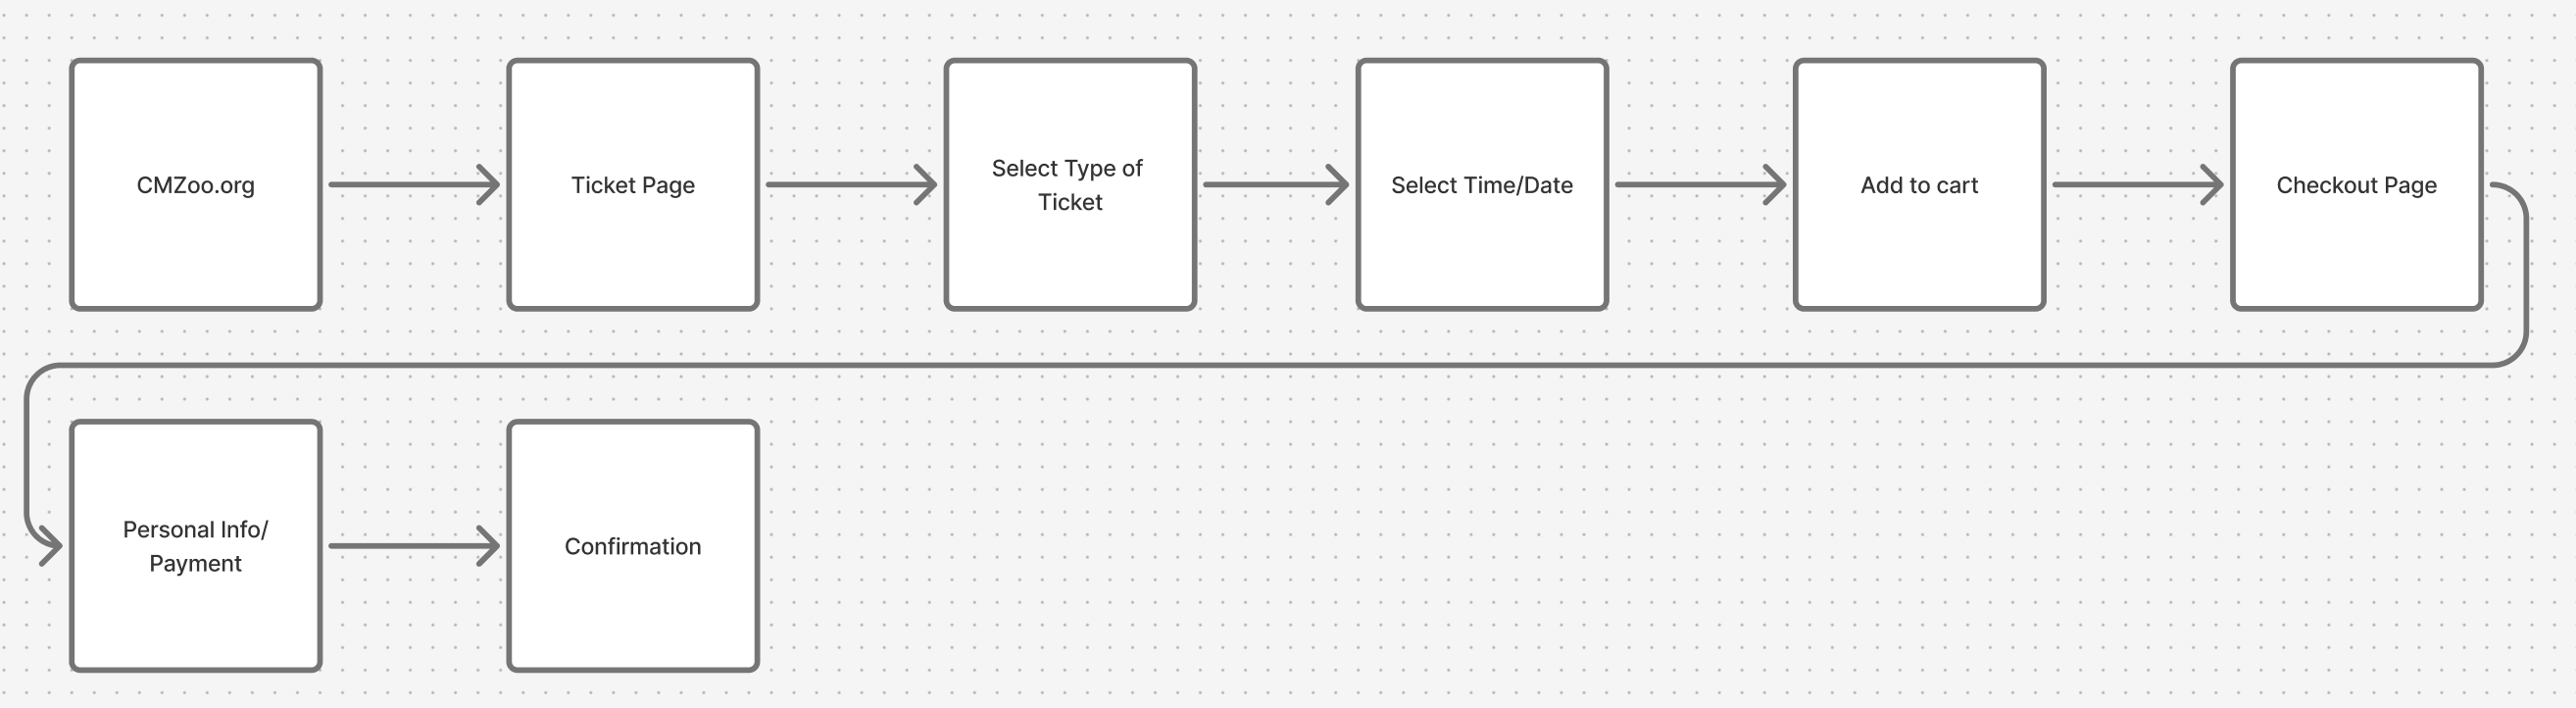
Task Flow
Based on the pain points from research, I mapped out a simplified task flow. The goal was to reduce the number of steps and redirects users experienced on the original site.
Design Inspiration
Something I learned from my PM internship at Maximal Learning is that the lead designer, Joe Alterio, told me to not reinvent the wheel. I took that to heart...almost all of the redesign I did was based off of websites that already worked.
| Element | Inspiration |
|---|---|
| Calendar | Melbourne Zoo |
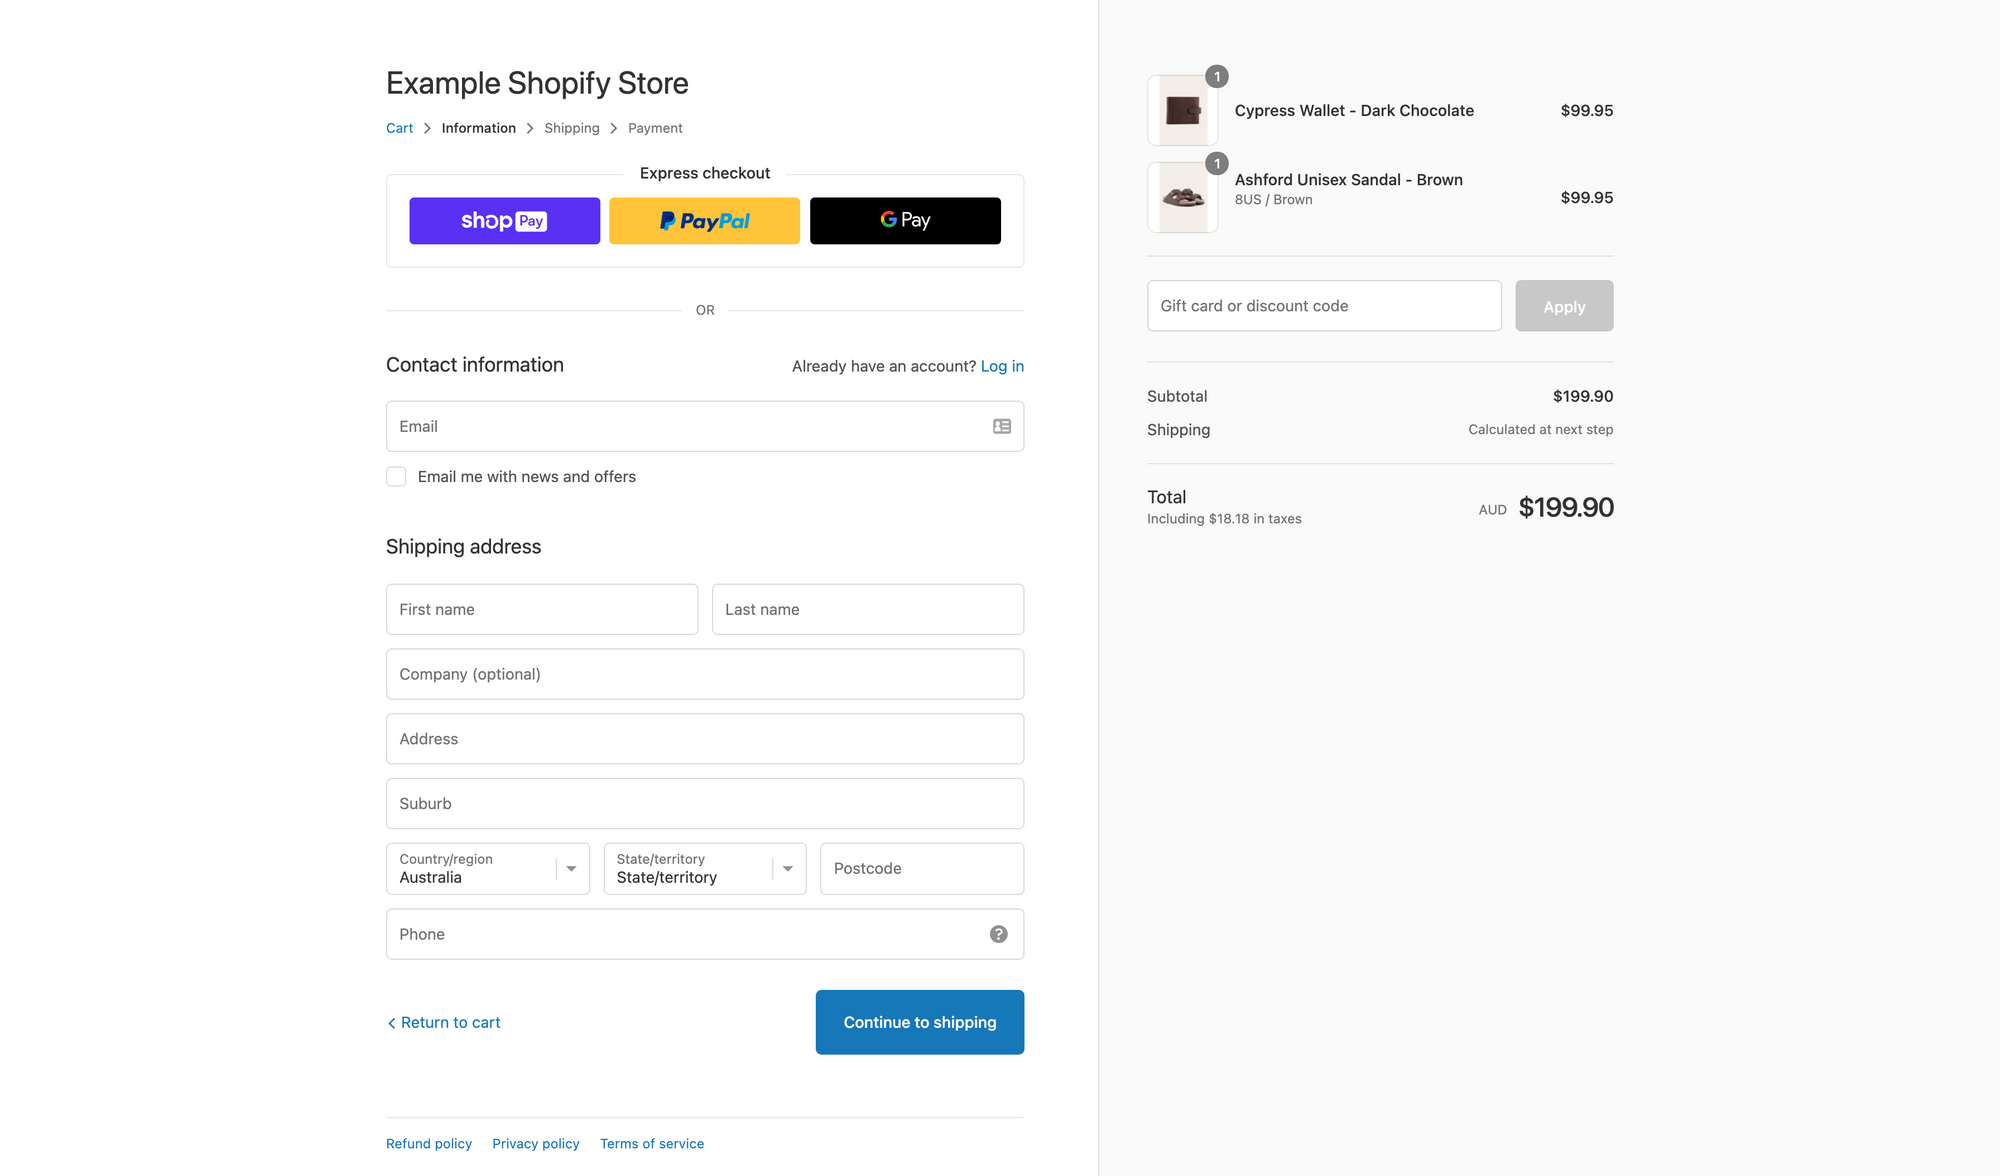
| Checkout process | Shopify |
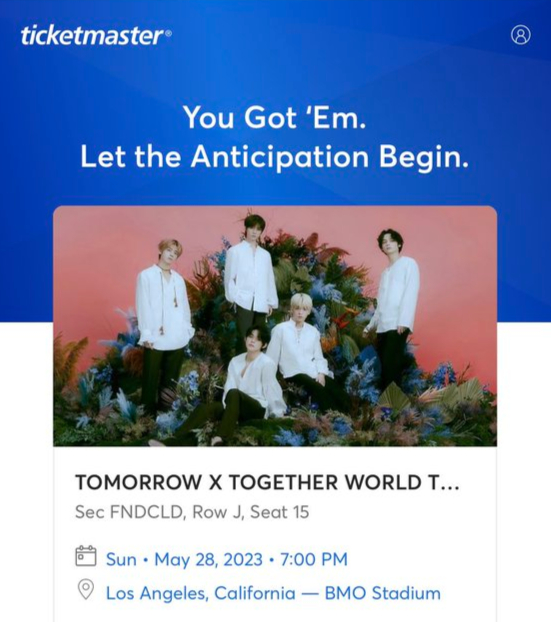
| Success page | TicketMaster |
Calendar - Melbourne Zoo
Checkout Process - Shopify
Success Page - TicketMaster
Branding
Another part of our project was to do a redesigned branding and choose different colors that were AA compliant.
I went about that by choosing colors that matched the idea of a zoo, while also taking inspiration from Cheyenne Mountain Zoo's current branding...which used a lot of greens. But the greens I used were slightly different—more modern, I would say. I took inspiration from REI's design system because I felt like it was a similar vibe. Same thing for the fonts. I wanted something similar to the original but more modern.
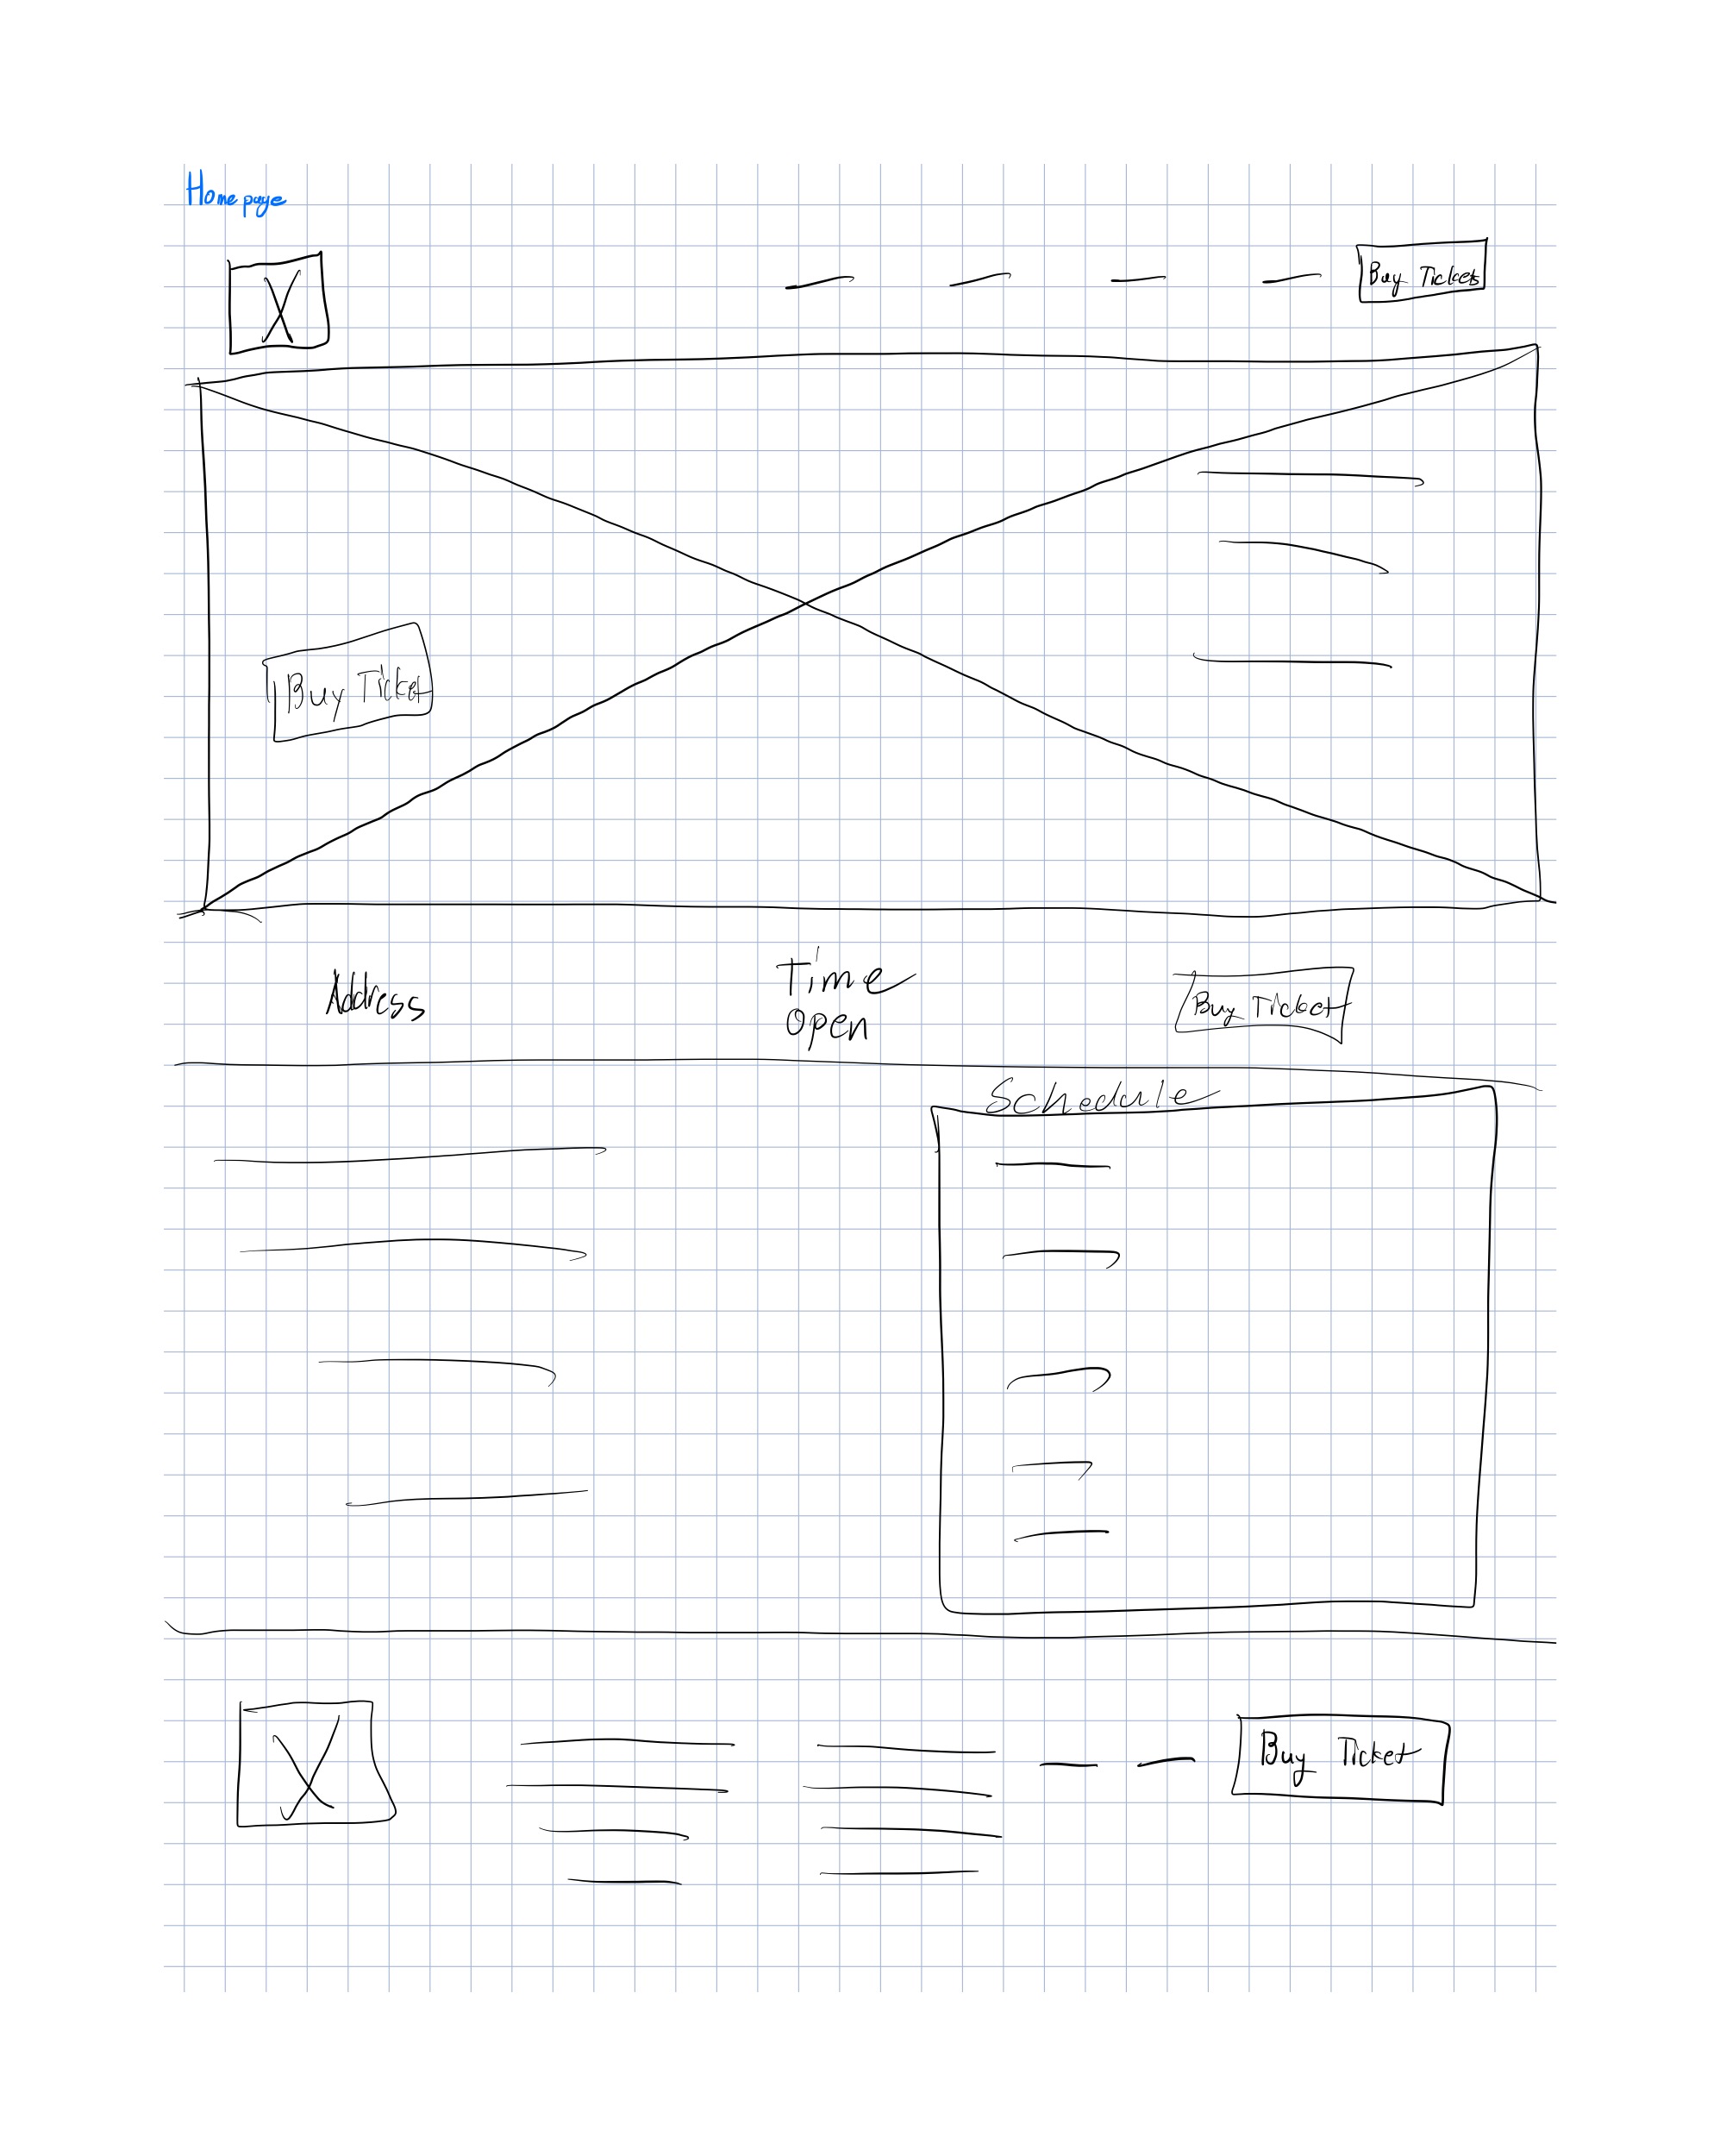
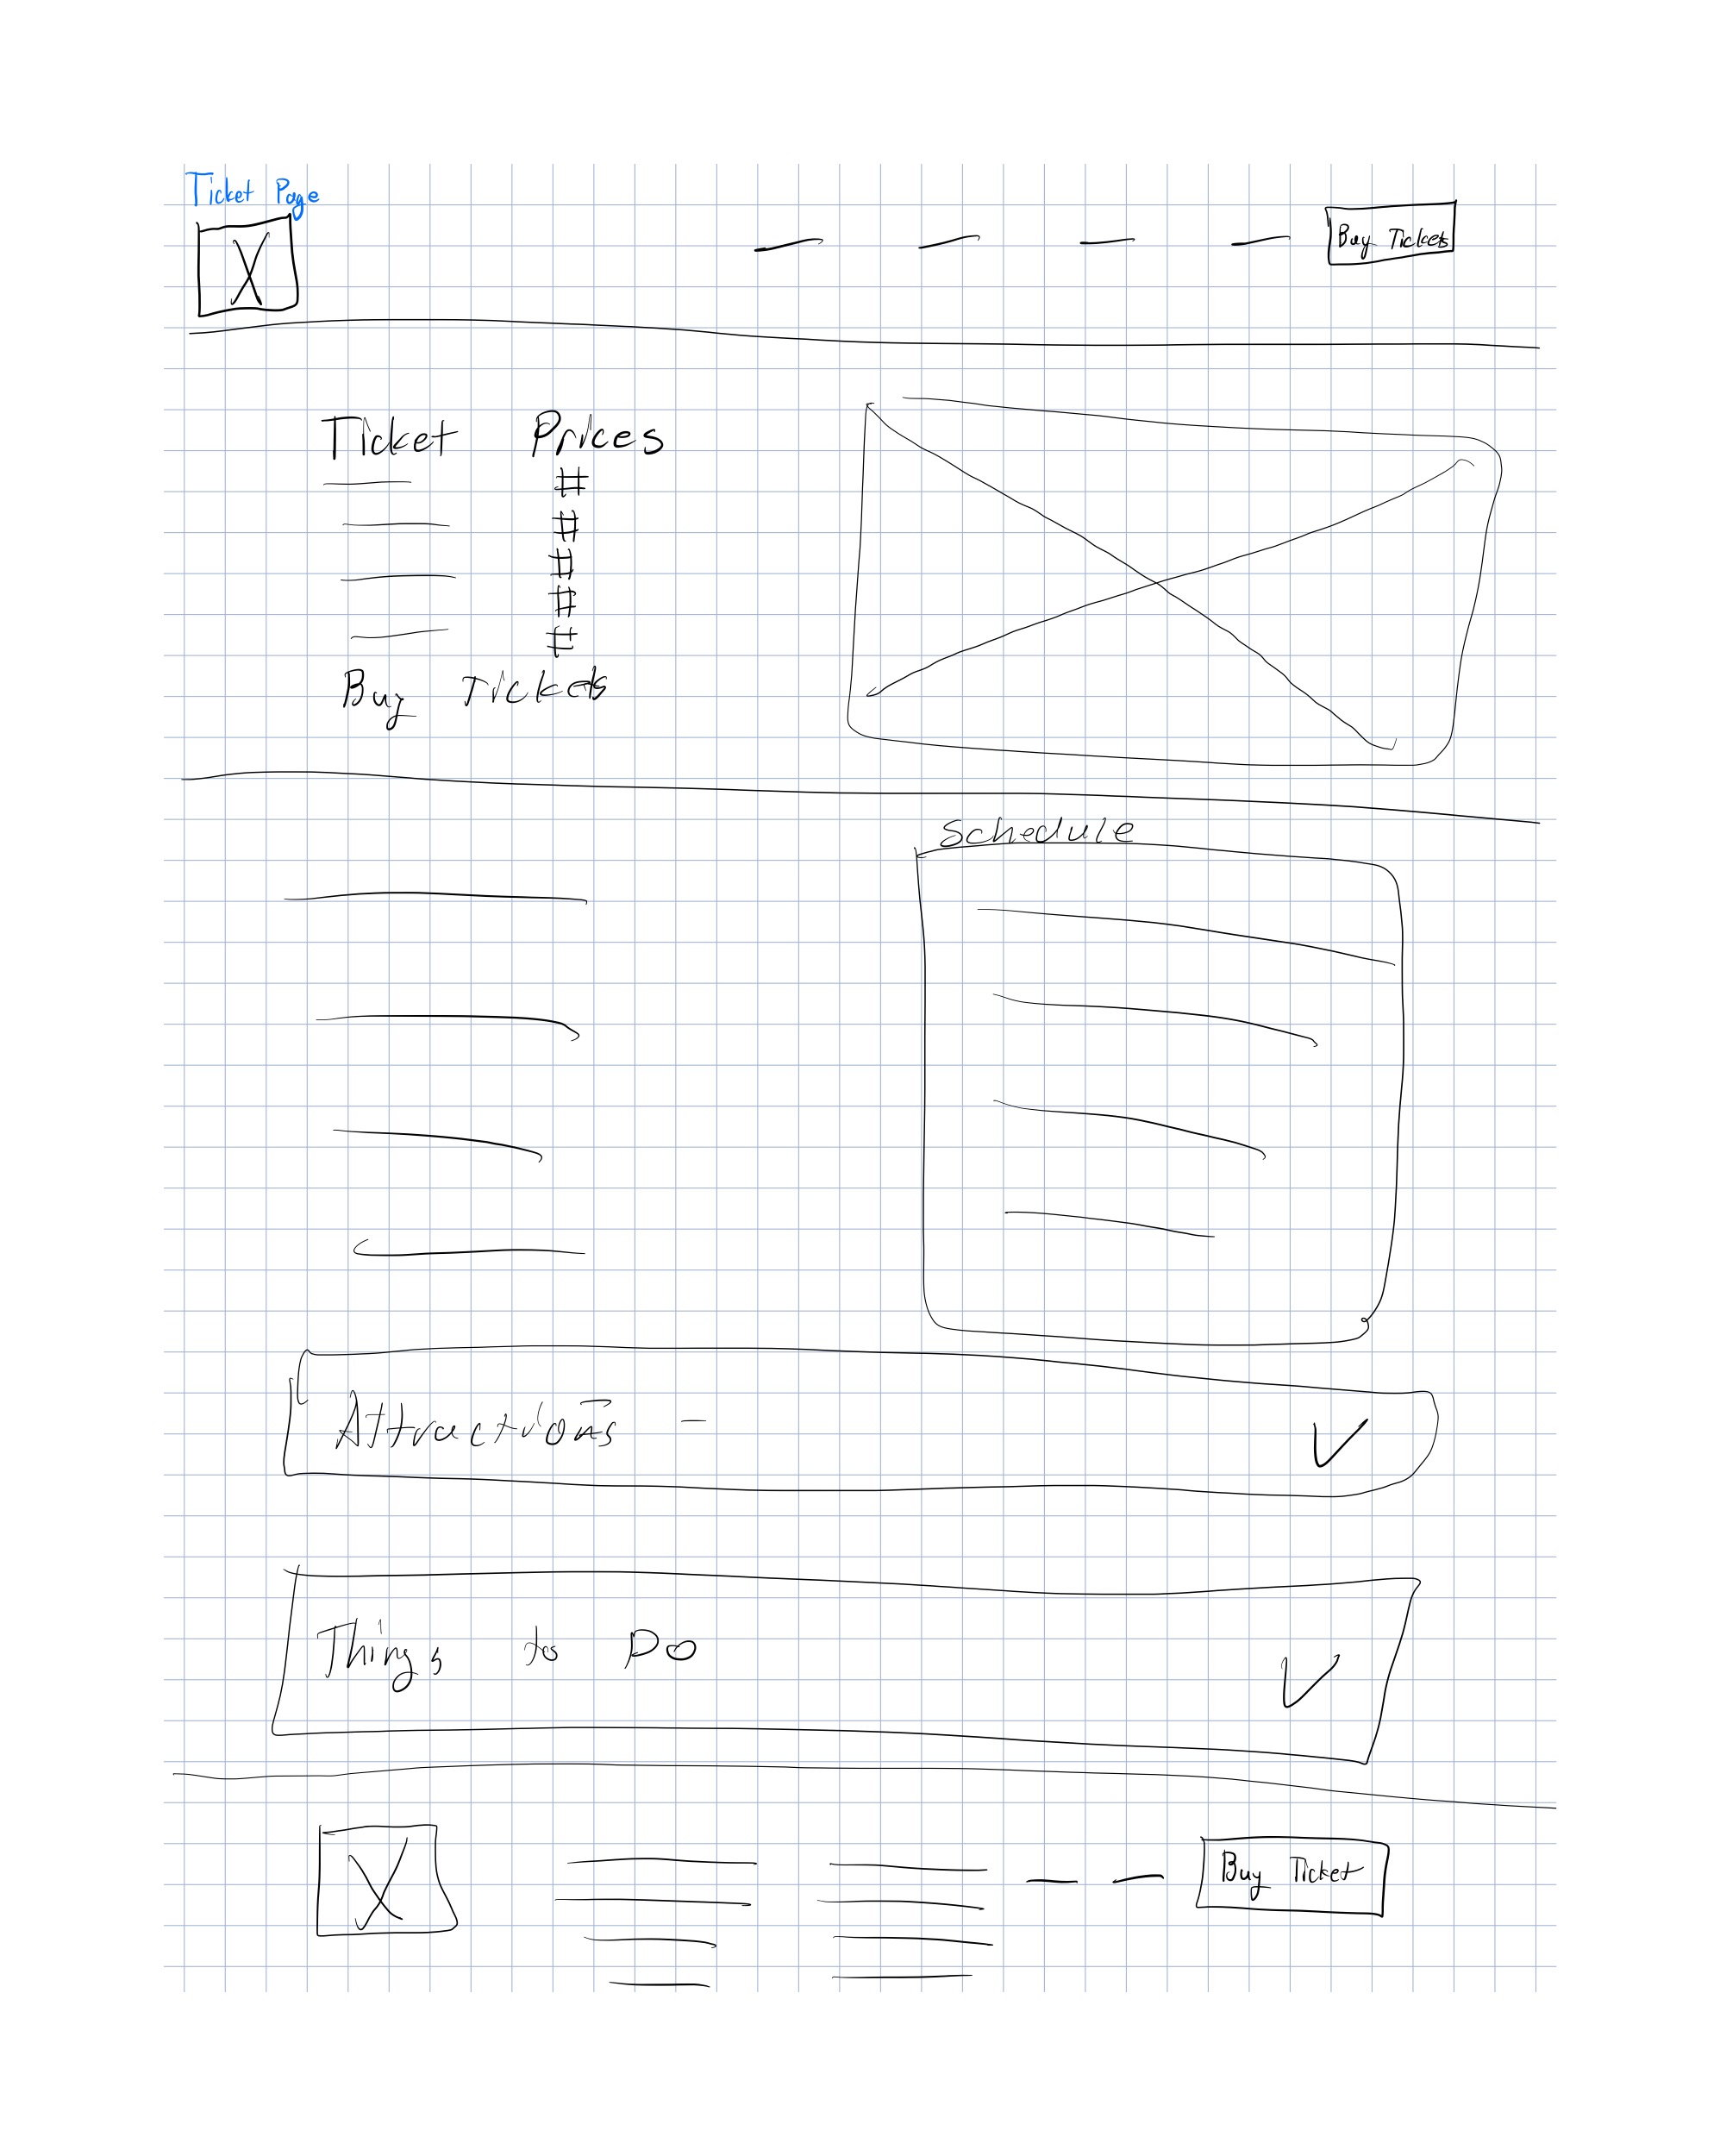
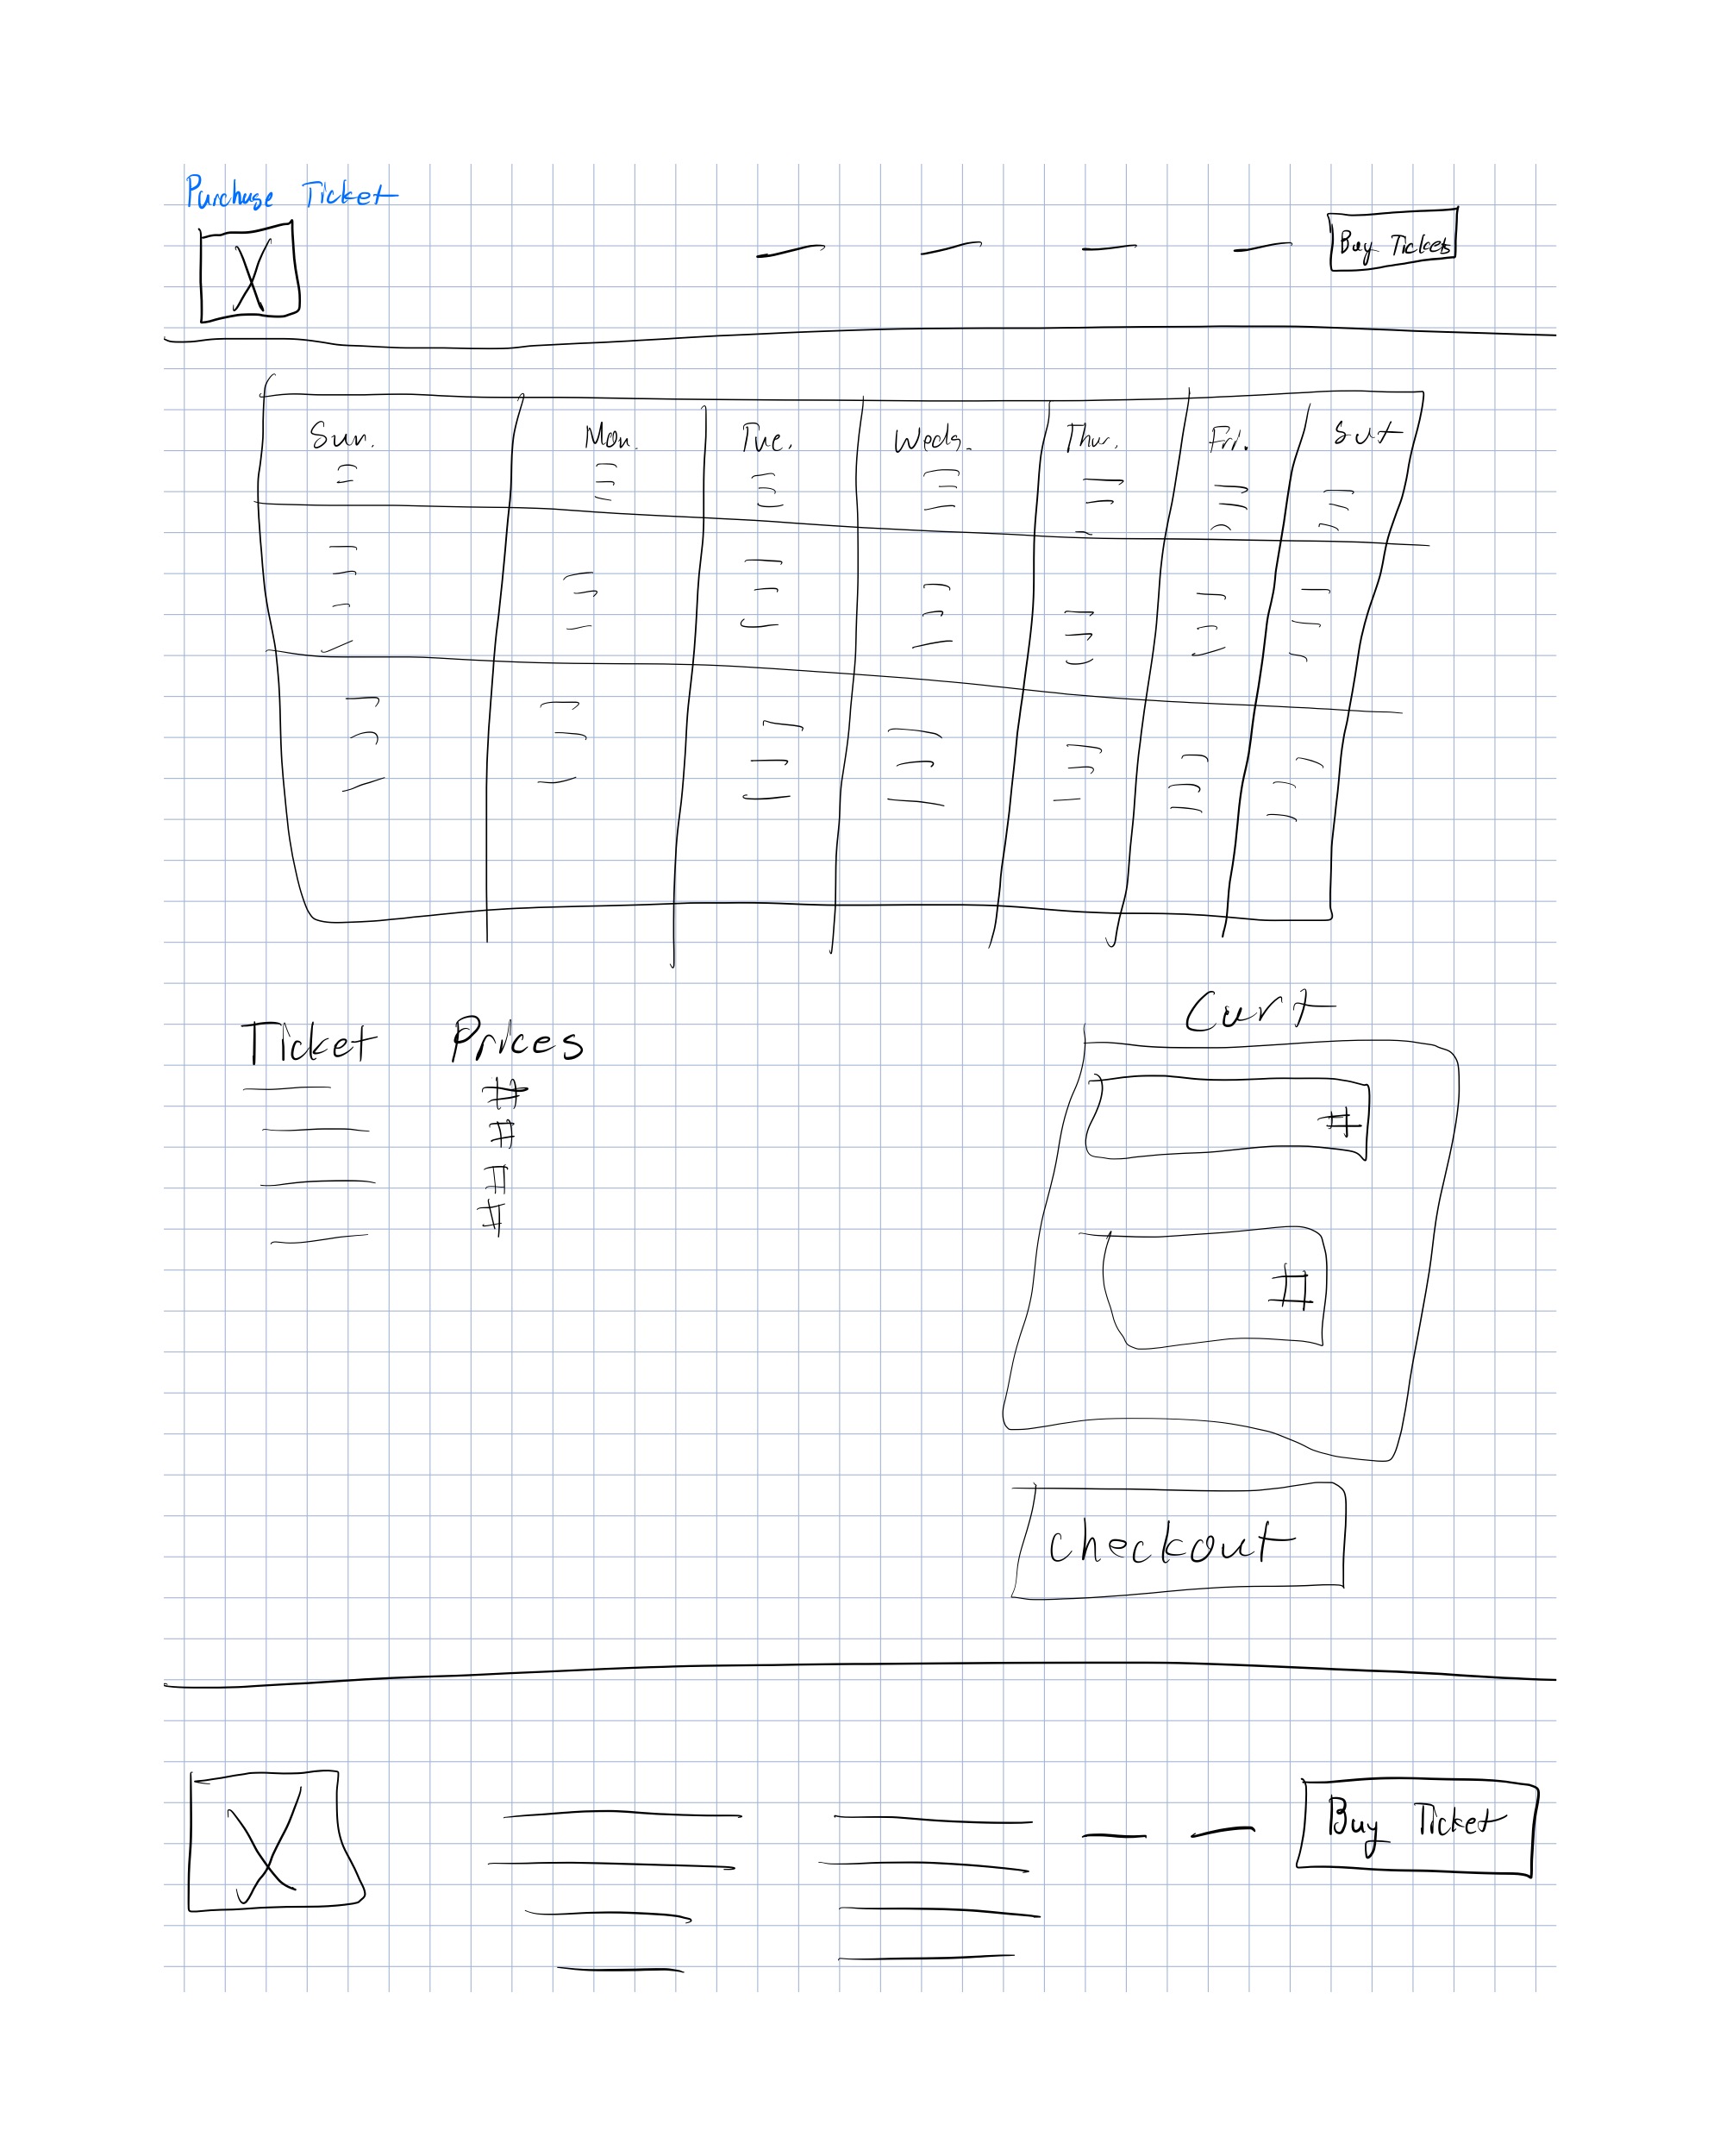
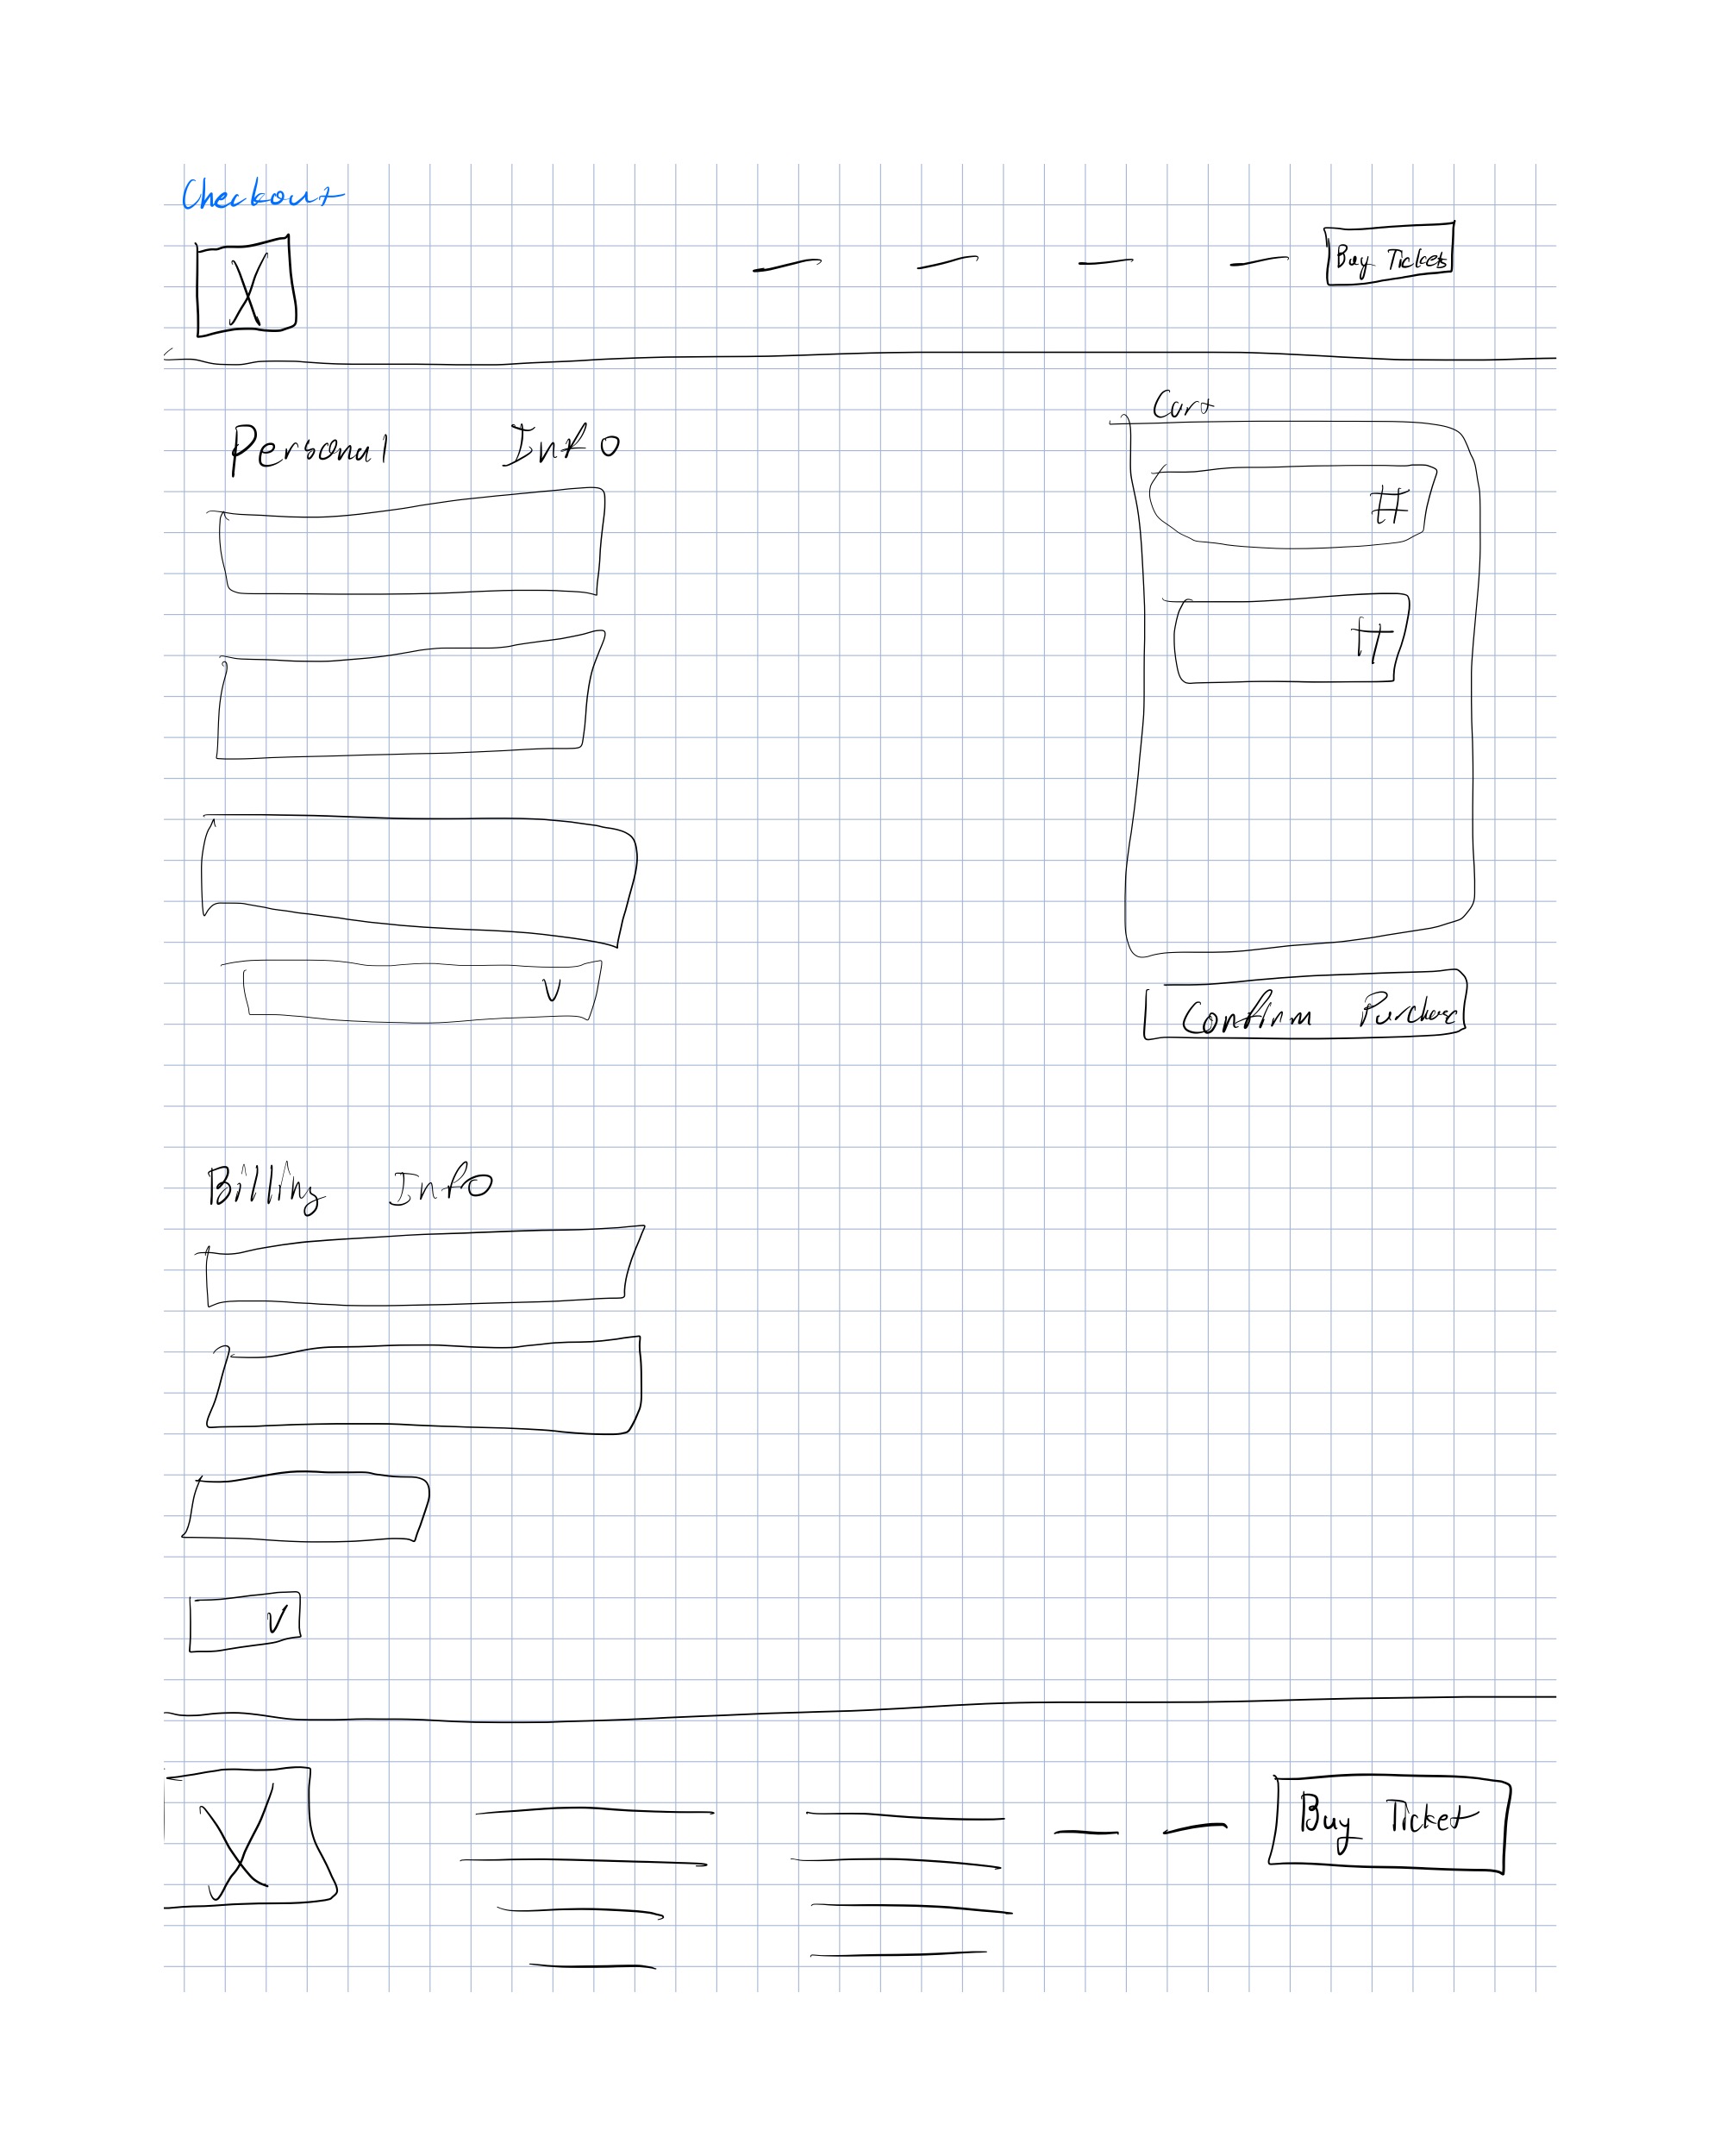
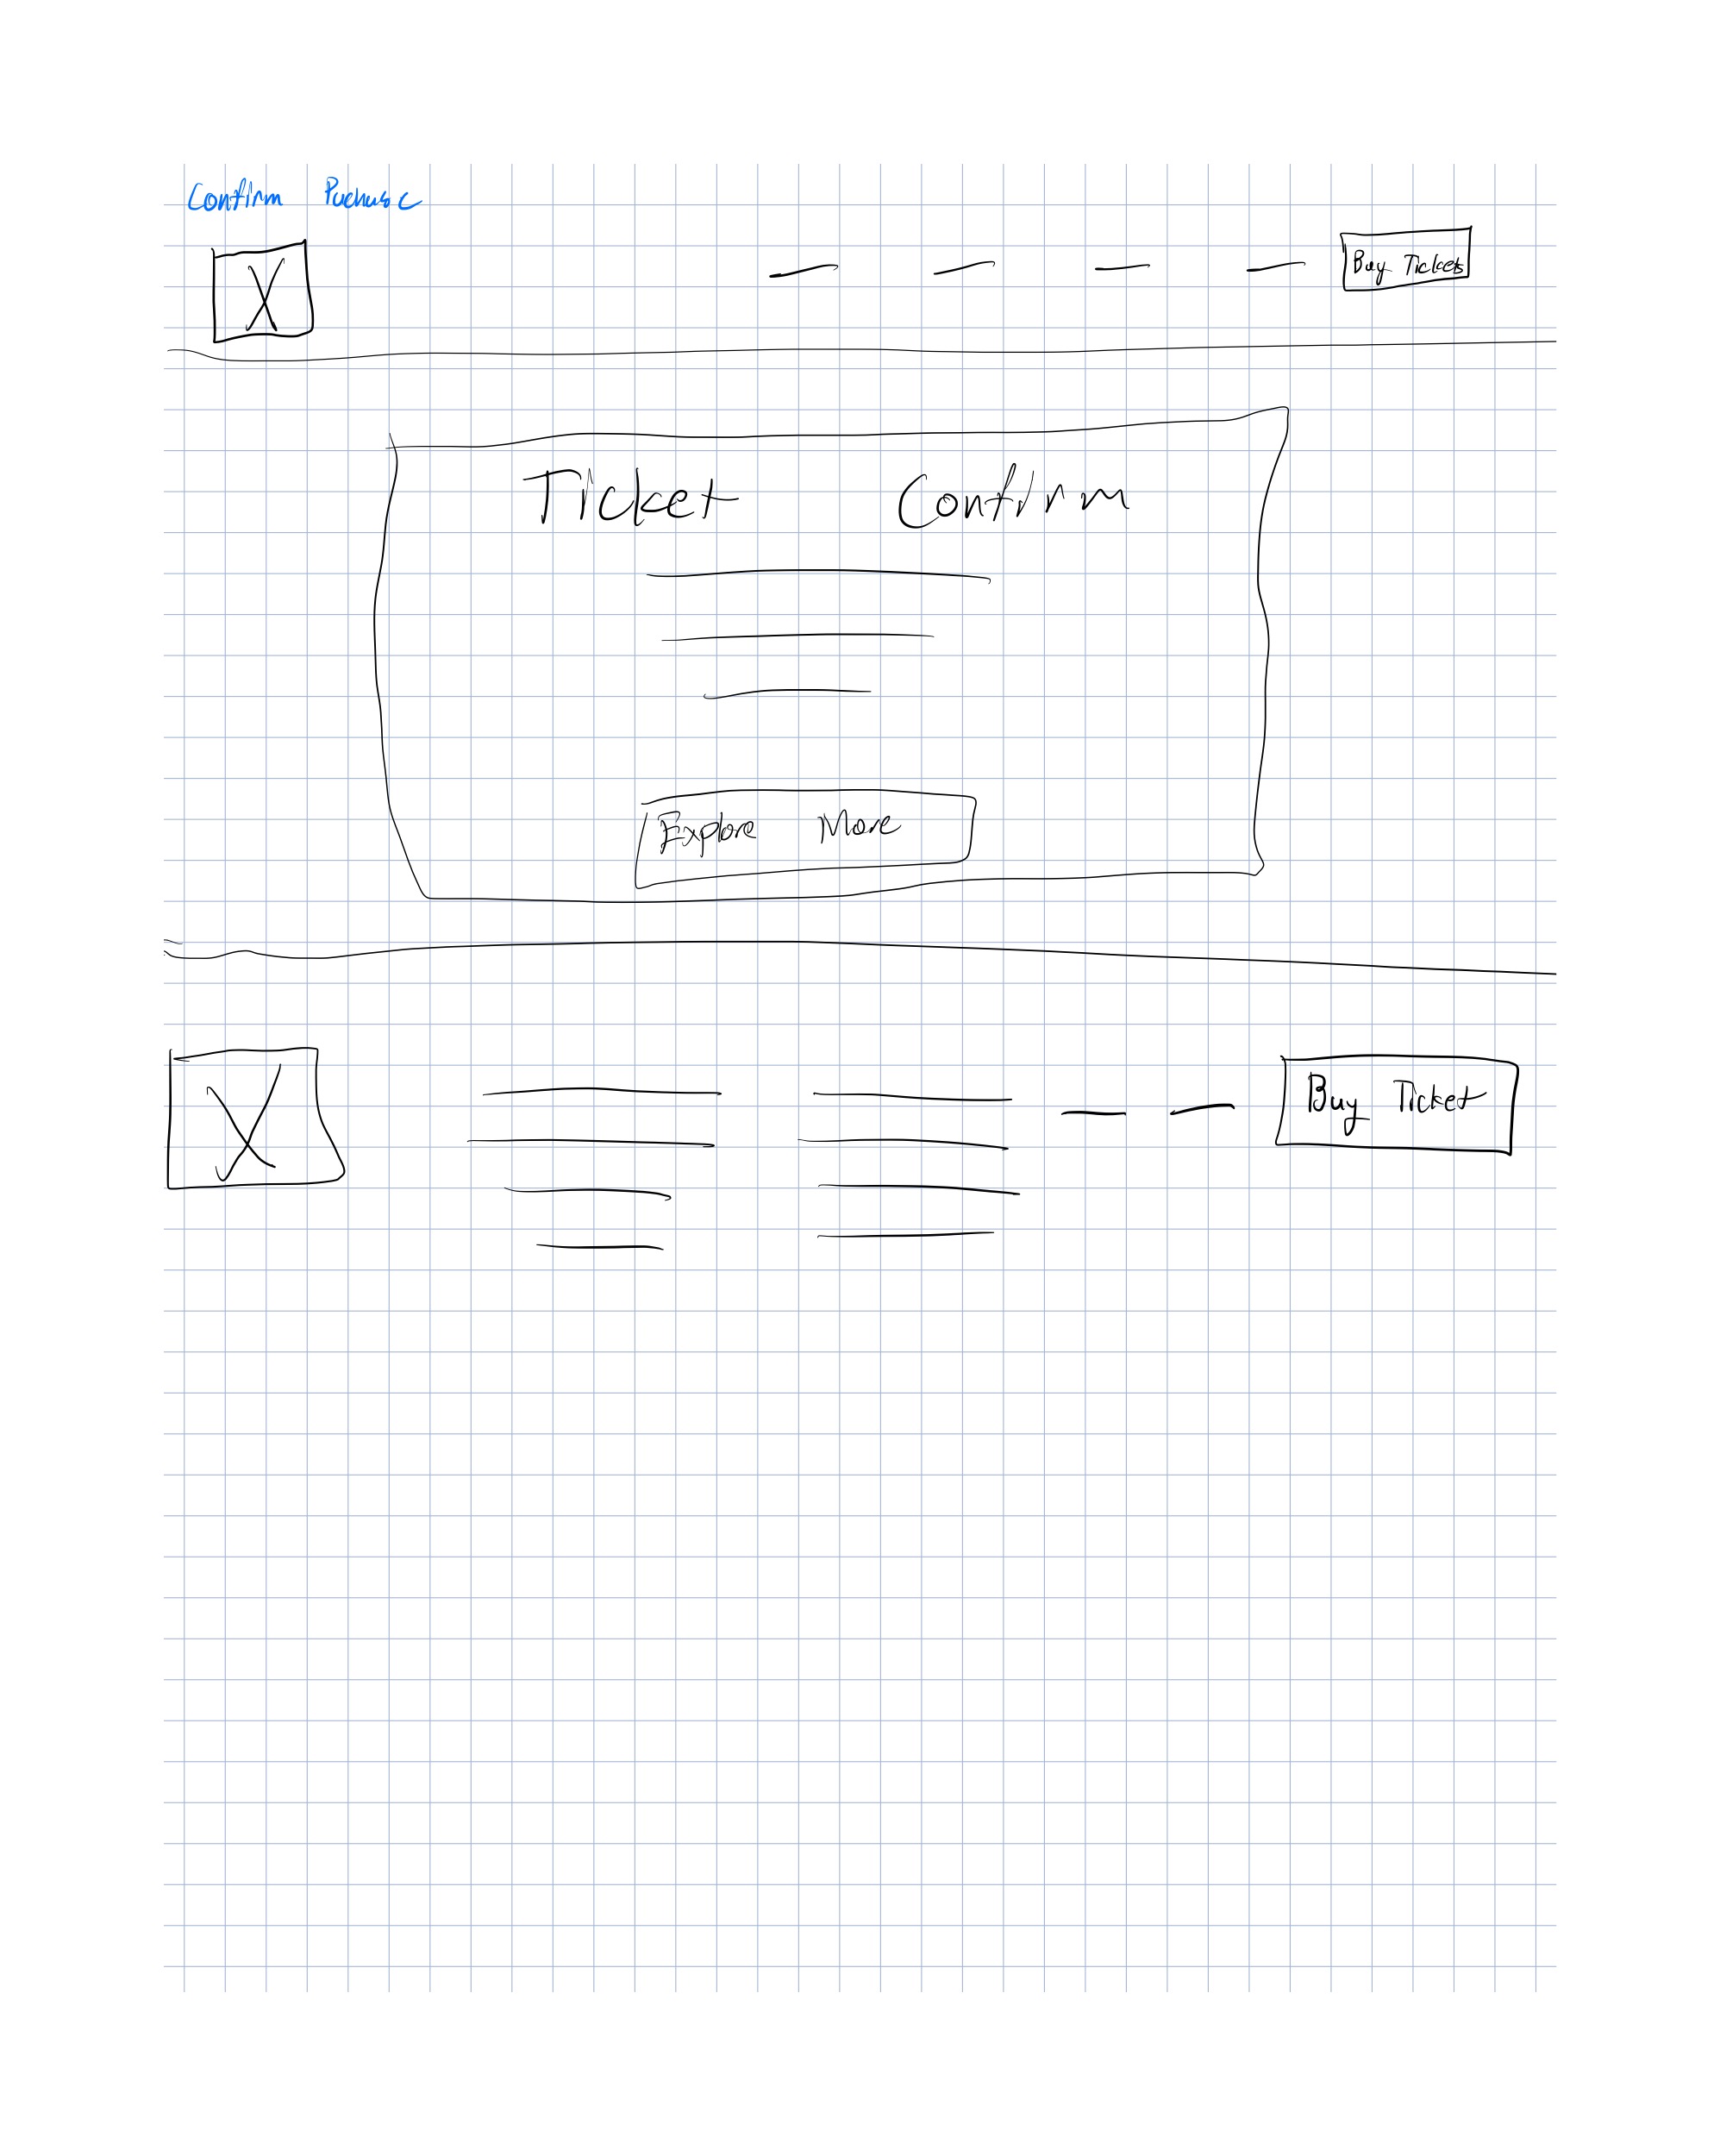
Low-Fidelity Wireframes
That design inspiration is where I got my "how-to" for the low-fidelity wireframes. I started with hand-drawn sketches to quickly explore layout options for the homepage, ticket page, purchase flow, checkout, and confirmation screens. These helped me figure out the basic hierarchy and where key elements like the calendar, ticket selection, and cart summary should live.
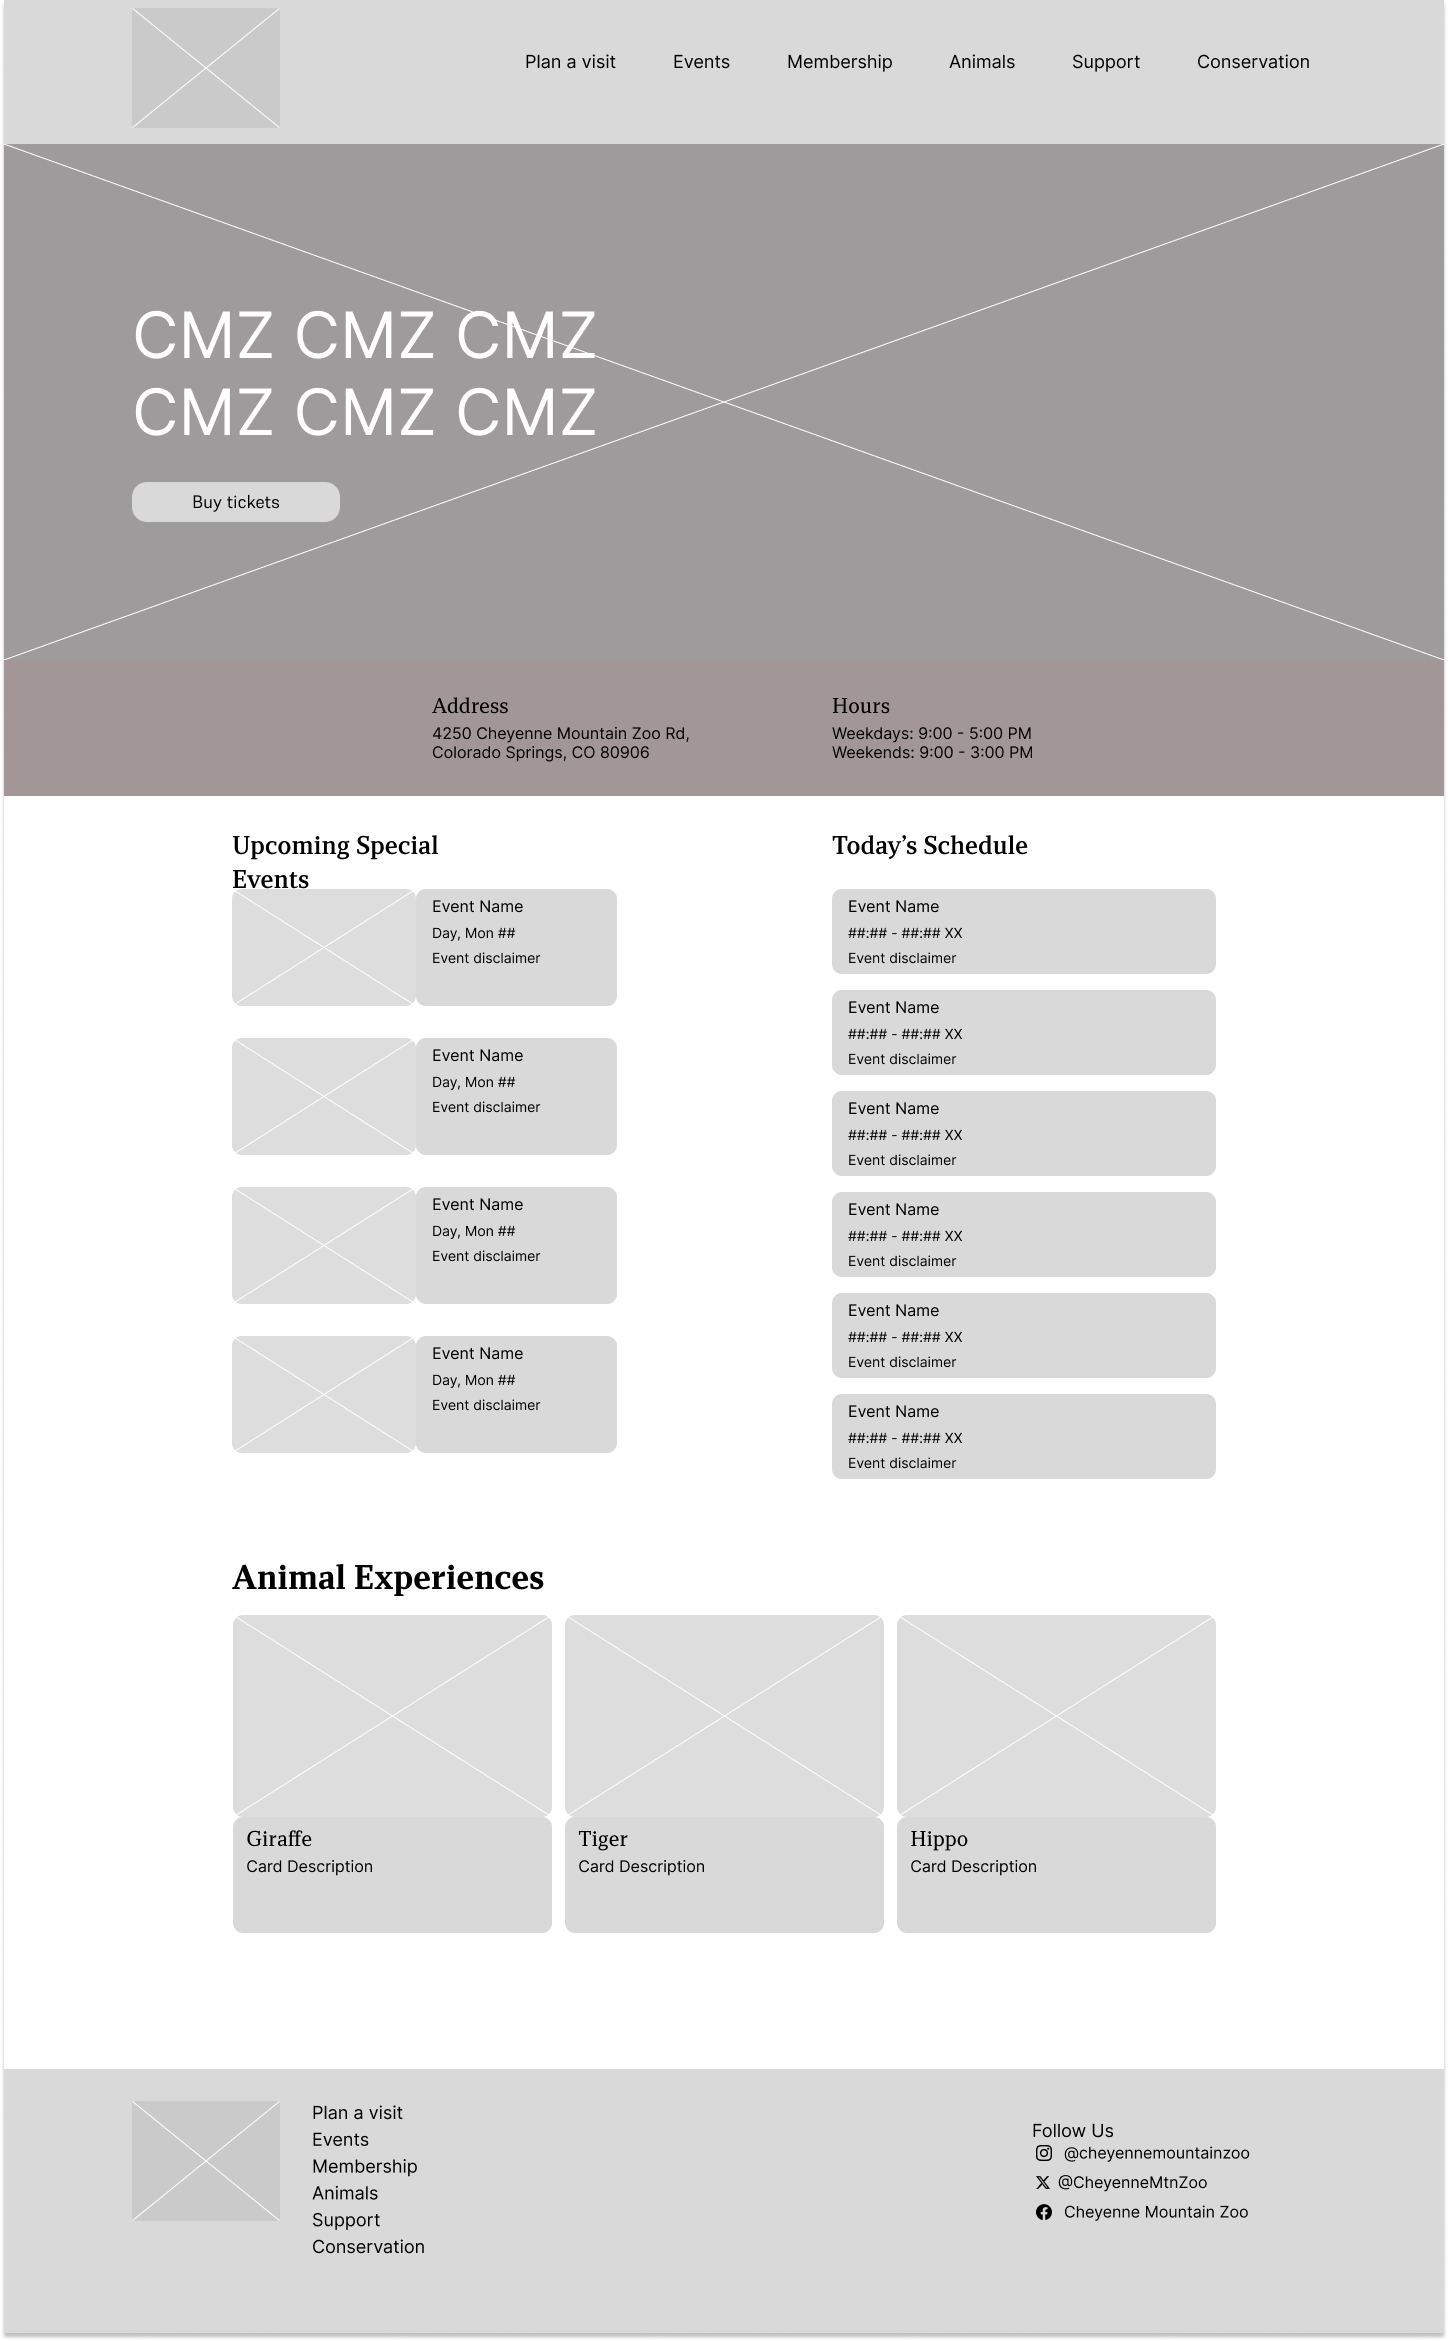
Mid-Fidelity Wireframes
From there, I iterated for mid-fidelity. I translated my sketches into digital grayscale wireframes in Figma. This stage was about refining the layout, establishing consistent spacing, and working through the interaction flow. I consolidated the date selection, time selection, and ticket quantity onto a single scrolling page, resulting in fewer steps in the purchase process.
 - D2.png)
 - D2.png)
 - D2.png)
 - D3.png)
 - D4.png)
TA Feedback
Throughout the design process, I received feedback from my TA (James Tran) that shaped my iterations.
Mid-fidelity feedback:
- Fix the order of the date/time/quantity screens—felt confusing
- Add a message about email ticket delivery
- Address an empty cart displaying before selections were made
- Use real content instead of placeholder text
High-fidelity v1 feedback:
- Align content with headings—some indents felt strange
- Check spacing increments (increments of 8)
- Consider different layout patterns for certain sections
- Box up special events to show they're separate
High-Fidelity v1
Based on this feedback, I created my first high-fidelity prototype. I applied my own branding, typography, and imagery to make it polished and interactive.
Changes I made based on feedback:
I reordered the screens so the flow made more sense, added the "tickets will be delivered by email" message, fixed the empty cart state, and replaced placeholder text with real content. For high-fidelity, I refined the spacing, alignments, and layout patterns to create a cleaner, more consistent final prototype.
Evaluation and Results
Prototype Testing
I conducted usability testing on my high-fidelity prototype with three participants. Each participant was given the same scenario, purchasing tickets for a family zoo visit, and asked to think aloud as they navigated through the prototype.
Improvements from Original Design
Testing right away revealed the fact that there was improvement to the original design. Compared to the original usability testing interviews, where people described the experience as "ugly," "outdated," and "annoying," most of the comments about the prototype were a complete shift.
| Original Website Feedback | Prototype Feedback |
|---|---|
| "It sucked, I didn't really enjoy it" | "It's nice, concise" |
| "The website kind of sucks" | "Everything works the way it should work" |
| "Oh my god, this is so bad" | "The format is easy to follow" |
| "Annoying and feels outdated" | "Does exactly what you expect it to do" |
| "Confusing, non-intuitive" | "The calendar is clear" |
Key Pain Points Identified
While the overall experience did improve significantly, there were still some things that could be improved:
| Issue | Details |
|---|---|
| Financial transparency | "Where are the taxes? Can I add a discount code?" |
| Unclear ticket categories | "What ages qualify for each ticket type?" |
| Post-purchase uncertainty | "How will I receive my tickets?" |
| Time selection confusion | Grey highlight looked similar to unavailable dates |
| Hidden content | Users didn't realize page expanded after time selection |
High-Fidelity v2 Updates
Based on that feedback, I made a couple more updates to the final v2 prototype, alongside feedback from my instructor(s). (Thanks Brittney and James <3)
| Change | Why |
|---|---|
| Added "Taxes and fees included" | Address financial transparency concerns |
| Added age ranges to tickets (Adult 12-64, Child 3-11, etc.) | Clarify who qualifies for each category |
| Added "Check your email for your tickets" | Clarify ticket delivery |
| Changed time selection from grey to green | Differentiate from unavailable calendar dates |
| Standardized spacing, input sizes, button sizes | Consistent visual design per TA feedback |
And so I landed on this final prototype:
Next Steps and Reflections
Future Plans
Implement more requested features
Add a discount code field and scroll indicator to address usability issues. Multiple users asked about coupons during testing, and users didn't realize the page expanded after time selection.
Design around KPIs & Analytics
Gather quantitative business data—understanding where users drop off, viewing heat maps, and seeing actual conversion metrics to identify which features drive engagement and support adoption.
A/B Testing Different Solutions
Test different design possibilities to see which one is the most optimal. There were many variations during the design process that could be explored through A/B testing.
Looking beyond the immediate fixes, I would want to revisit the overall ticketing structure. Many testers were confused by timed entry windows, which was unique to this zoo. I would also add pricing explanations—users were confused about why prices varied by date, but I held off to keep the page simple.
Key Takeaways
This project taught me the full UX process from research through high-fidelity prototyping. It showed me how to move beyond my own assumptions as a designer and actually validate ideas in the field.
Learning the 8px grid system was honestly life-changing. Coming from a computer science background, I always wondered how designers kept everything consistent. It answered the question of how pixel measurements stay uniform across components—something I had to grapple with when building websites in code.
It was reassuring to see how data-focused UX is. Going into the project, I didn't have much UX experience, but I always wanted data to back up design decisions. Seeing research and testing as core parts of the UX process validated my instinct that good design should be grounded in evidence, not just intuition.