Spectrum · Summer 2026
The Problem Wasn't the Network
Why a group of Invincible WiFi customers kept calling support, and what nobody was telling them
- Role
- WiFi Product Intern, Spectrum
- Timeline
- Summer 2026 (10 weeks)
- Skills
- Root-cause analysis
- Opportunity sizing
- Cross-functional investigation
- Prototyping
- Tools
- Python
- Claude API
Overview
A plan change nobody explained was flooding support
This summer I was a product intern on Spectrum's WiFi team, and I led an investigation into a group of Invincible WiFi customers who'd been moved off the plan and then started flooding support. To even get the data, I built a small AI-assisted tool that pulled scattered customer-interaction data into one place, so we could look at the whole group instead of one account at a time. The answer wasn't really a hardware problem. The plan change never reached the customers, the support agents, or the technicians who had to deal with it, and that gap was driving real, avoidable cost. I sized it, presented it to our Director, and prototyped a fix that went to the self-service team.
The problem
The question sounded simple. The data wasn't.
Invincible WiFi is Spectrum's backup-internet plan, built to keep people online even when their main connection drops. Some customers were moved off the plan, and that decision belonged to another team. My job was to figure out what happened after, and why.
The question sounded simple: what did this cost us, and what went wrong?
A few things made it harder than it sounded:
The data didn't live in one place
Calls, chats, app activity, and call transcripts all sat in separate systems with no integration path between them.
I didn't own the decision
I was investigating a change another team made, so anything I found had to land as a finding, not a finger-point.
I couldn't talk to customers directly
My window into what they experienced was what they said on calls and in chats.
First move
I stopped reading accounts one at a time
The obvious approach was manual review: open an account, read its history, take notes, move to the next one. That works for a handful of accounts. It doesn't work for hundreds, and it definitely doesn't let you see patterns across them.
So I built a tool. It's a Python script that uses the Claude API to pull app, call, and chat activity together with call transcripts for each account, then summarizes what actually happened. It turned a case-by-case slog into something I could run across the whole group, and later across thousands of accounts.
That changed the kind of question we could ask. Instead of "what's going on with this customer," it became "what's going on with all of them, and why."
What the data said
Everyone was missing the same piece of information
The first thing I found was that the count was off. When I verified the flagged accounts one by one against the service records, the real number of downgrades was noticeably smaller than the working estimate. Before I could size anything, I had to make sure I was sizing the right thing.
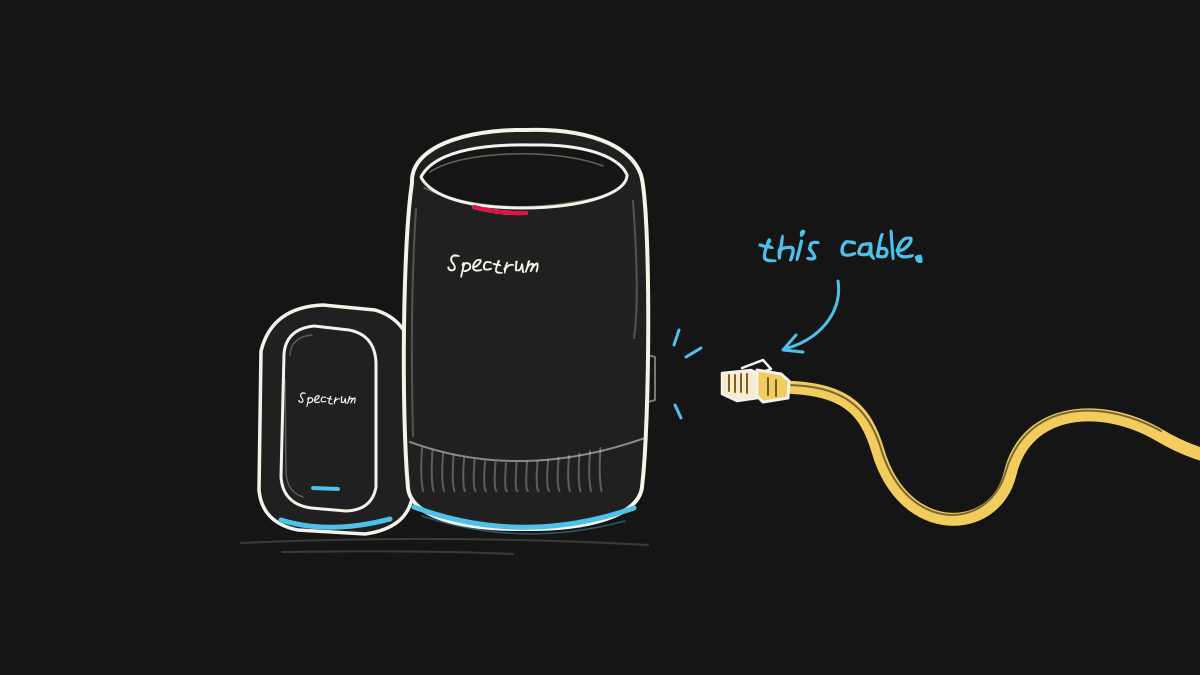
Then I looked at what those customers did after the change. Most of them reached out to support, through the app, by phone, or through chat. Calls were long. And some ended with a technician sent to the customer's home for things like reconnecting an Ethernet cable.
The more calls and transcripts I read, the clearer the pattern got. Everyone involved was missing the same piece of information:
| Who | What they saw | What they didn't know |
|---|---|---|
| Customer | Their internet wasn't working the way it used to | Their plan had changed |
| Support agent | A confused customer on a long call | That a downgrade had happened at all |
| Field technician | Invincible WiFi equipment on an account that didn't have the plan | Why |
The real problem
The cost came from the communication gap, not the downgrade
The downgrade itself wasn't what was driving the cost. The communication gap was. Nobody downstream knew what had changed, so every call started from zero and every technician walked into a mystery.
How might we
How might we make sure that when something changes or breaks, the customer, the agent, and the technician all know what actually happened, in words that point to the fix?
Sizing it
The dollar figure was the evidence, not the headline
Using the support team's per-call and per-visit costs, I built a cost model for the avoidable support spend this one group generated, and presented it along with the root cause to our Director.
Honestly though, the dollar figure is the supporting evidence, not the headline. The headline is that people were getting a technician visit to fix a cable, and it happened because nobody told them what was going on.
Going wider
The same pattern showed up everywhere
Once the tool worked, I ran it across a much larger set of accounts to see whether this was a one-off. I sorted the failures into categories, and the biggest one wasn't exotic at all: cable faults, disconnections, and plugging into the wrong port. Every one of those is something a customer can fix themselves.
So I looked at what we were telling customers when those faults happened. The notifications led with generic "restart your router" steps and buried the actual cause in a paragraph. Most of the failures were Ethernet-related, and the message basically never said so.
That's the same problem as the downgrade, just smaller and more frequent. We knew what was wrong. We just weren't saying it.
The solution
Name the diagnosis, then show it
I made two recommendations:
1. Name the diagnosis
Rewrite fault notifications so the first thing a customer reads is what's wrong ("your cable looks unplugged"), not a generic troubleshooting script.
2. Show, don't tell
I prototyped a visual diagnostic that uses the router's own telemetry to detect a cable fault and alert the customer proactively, showing them exactly which cable and which port.
For the visuals, I reused the router-setup graphics customers already see when they install their equipment. They're already familiar, already approved, and it meant the idea could move forward without a new design project. I estimated how much support spend it could deflect, and it was handed off to the self-service team.
What I scoped out
I went after what I could actually change
The downgrade policy itself. Whether customers should have been moved off the plan was another team's call. I focused on what happened after, which is where I could actually change something.
Every failure category. I went after the biggest customer-fixable one instead of trying to redesign troubleshooting for everything.
New visual design. Reusing existing setup graphics was a deliberate trade: less polish, much faster path to adoption.
Outcomes
A tool that got adopted, and a fix that got handed off
| What | Result |
|---|---|
| Analysis tool | Adopted by a partner team |
| Downgrade investigation | Root cause and cost model presented to our Director |
| Visual diagnostic | Prototype handed to the self-service team (deflection is an estimate, not a measured result) |
The diagnostic didn't ship while I was there, so I don't have real results. If it does, here's what I'd measure:
- Call rate after a cable-fault alert, vs. the current notification
- Technician visits for customer-fixable issues
- Share of customers who fix the problem themselves after seeing the visual
Reflection
What I learned
What I'd Do Differently
Verify the list on day one
I found the count was off partway through. Checking the denominator first would've saved me rework.
Get to the recommendation sooner
I spent a lot of the summer measuring the problem. The recommendation is what moved people, and I could've started drafting it earlier.
What I Learned
The expensive part isn't always the broken part. Most of the cost here came from confusion, not failure.
Build the tool when the question outgrows the spreadsheet. The investigation only worked because I stopped doing it by hand.
The number supports the story; it isn't the story. People remember "a technician visit to plug in a cable" a lot longer than a total.
Most of the support cost I found wasn't caused by anything breaking. It was caused by nobody saying what broke. Sometimes the highest-leverage product change is just a clearer sentence.
Some figures and internal details from this project are left out because the work is internal to Spectrum. If you'd like to hear the full version, including the numbers, reach out. I'm happy to walk through it.